by Larry Dragich
Director EAS, Auto Club Group
Application Performance Management (APM) has many
benefits when implemented with the right support structure and sponsorship. It’s the key for managing action, going red
to green, and trending on performance.
As you strive to achieve new levels of sophistication
when creating performance baselines, it is important to consider how you will
navigate the oscillating winds of application behavior as the numbers come in
from all directions. The behavioral
context of the user will highlight key threshold settings to consider as you
build a framework for real-time alerting into your APM solution.
This will take an understanding of the application and an
analysis of the numbers as you begin looking at user patterns. Metrics play a key role in providing this
value through different views across multiple comparisons. Absent from any behavioral learning engines which are now emerging in the APM
space, you can begin a high level analysis on your own to come to a common
understanding of each business application’s performance.
 Just as water seeks its own level, an application performance baseline will
eventually emerge as you track the real-time performance metrics outlining the
high and low watermarks of the application.
This will include the occasional anomalous wave that comes crashing
through affecting the user experience as the numbers fluctuate.
Depending on transaction
volume and performance characteristics there will be a certain level of noise
that you will need to squelch to a volume level that can be analyzed. When crunching the numbers and distilling
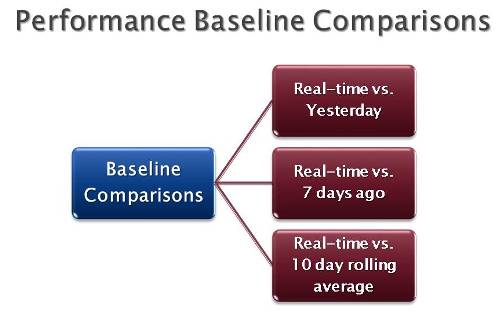
patterns, it will be essential to create three baseline comparisons
that you will use like a compass for navigation into what is real and what is
an exception.
Real-time vs. Yesterday
As the real-time performance metrics come in, it is important to watch the
application performance at least at the five minute interval as compared to the
day before to see if there are any obvious changes in performance.
Real-time vs. 7 days ago
Comparing Monday to Sunday may not be relevant if your core business hours
are M-F; using the real-time view and comparing it to the same day as the
previous week will be more useful.
Especially if a new release of the application was rolled out over the
weekend and you want to know how it compares with the previous week.
Real-time vs. 10 day
rolling average
Using a 10, 15 or 30 day rolling average is helpful in reviewing overall
application performance with the business, because everyone can easily
understand averages and what they mean when compared against a real-time view.
Capturing real-time performance metrics in five minute intervals is a good
place to start. Once you get a better
understanding of the application behavior you may increase or decrease the
interval as needed. For real-time performance alerting, using the averages
will give you a good picture when something is out of pattern, and to report on
Service Level Management using percentiles (90%, 95%, etc.), will help create
and accurate view for the business. To
make it simple to remember, alert on the
averages and profile with percentiles.
Conclusion
Operationally there are things you may not want to think about all
of the time (e.g. standard deviations, averages, percentiles, etc.), but you
have to think about them long enough to create the most accurate picture
possible as you begin to distill performance patterns with each business application. This can be
accomplished by building meaningful performance baselines that will help feed
your Service Level Management processes well into the future.
Related Links:
Prioritizing
Gartner's APM Model
Event Management:
Reactive, Proactive, or Predictive?